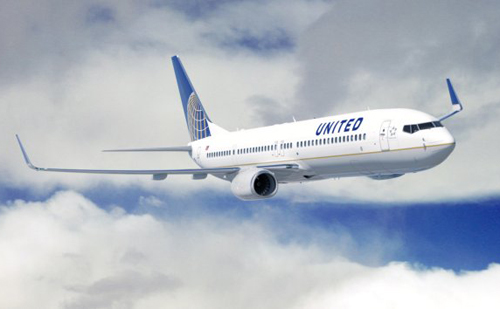
United Releases December 2012 Operational Performance

United Continental Holdings, Inc. reported December 2012 combined operational results for its airline units.
UAL’ s consolidated traffic (revenue passenger miles) in December 2012 decreased 4.0 percent and consolidated capacity (available seat miles) decreased 5.4 percent versus December 2011. UAL’s consolidated load factor in December 2012 increased 1.2 points compared to December 2011.
UAL’s December 2012 consolidated passenger revenue per available seat mile (PRASM) increased an estimated 2.5 to 3.5 percent compared to December 2011. Core passenger revenue growth showed sequential strength from November 2012 to December 2012, but was partially offset by year-end revenue adjustments.
| Preliminary Operational Results | ||||||||
| December | Year-to-Date | |||||||
| 2012 | 2011 | Change | 2012 | 2011 | Change | |||
| REVENUE PASSENGER MILES (000) | ||||||||
| Domestic | 7,294,836 | 7,752,603 | (5.9%) | 92,654,685 | 95,069,896 | (2.5%) | ||
| International | 6,838,979 | 6,982,065 | (2.0%) | 86,761,121 | 86,693,558 | 0.1% | ||
| Atlantic | 2,757,774 | 2,890,038 | (4.6%) | 37,817,032 | 39,280,149 | (3.7%) | ||
| Pacific | 2,600,344 | 2,616,274 | (0.6%) | 32,360,042 | 31,350,439 | 3.2% | ||
| Latin | 1,480,861 | 1,475,753 | 0.3% | 16,584,047 | 16,062,970 | 3.2% | ||
| Mainline | 14,133,815 | 14,734,668 | (4.1%) | 179,415,806 | 181,763,454 | (1.3%) | ||
| Regional | 2,071,797 | 2,148,219 | (3.6%) | 26,068,761 | 25,768,002 | 1.2% | ||
| Consolidated | 16,205,612 | 16,882,887 | (4.0%) | 205,484,567 | 207,531,456 | (1.0%) | ||
| AVAILABLE SEAT MILES (000) | ||||||||
| Domestic | 8,747,198 | 9,311,662 | (6.1%) | 109,105,345 | 111,734,624 | (2.4%) | ||
| International | 8,337,481 | 8,707,176 | (4.2%) | 107,224,901 | 107,702,131 | (0.4%) | ||
| Atlantic | 3,434,047 | 3,698,344 | (7.1%) | 47,428,563 | 49,189,706 | (3.6%) | ||
| Pacific | 3,070,544 | 3,160,691 | (2.9%) | 39,234,124 | 38,207,995 | 2.7% | ||
| Latin | 1,832,890 | 1,848,141 | (0.8%) | 20,562,214 | 20,304,430 | 1.3% | ||
| Mainline | 17,084,679 | 18,018,838 | (5.2%) | 216,330,246 | 219,436,755 | (1.4%) | ||
| Regional | 2,580,166 | 2,777,392 | (7.1%) | 32,529,763 | 33,091,282 | (1.7%) | ||
| Consolidated | 19,664,845 | 20,796,230 | (5.4%) | 248,860,009 | 252,528,037 | (1.5%) | ||
| PASSENGER LOAD FACTOR | ||||||||
| Domestic | 83.4% | 83.3% | 0.1 pts | 84.9% | 85.1% | (0.2) pts | ||
| International | 82.0% | 80.2% | 1.8 pts | 80.9% | 80.5% | 0.4 pts | ||
| Atlantic | 80.3% | 78.1% | 2.2 pts | 79.7% | 79.9% | (0.2) pts | ||
| Pacific | 84.7% | 82.8% | 1.9 pts | 82.5% | 82.1% | 0.4 pts | ||
| Latin | 80.8% | 79.9% | 0.9 pts | 80.7% | 79.1% | 1.6 pts | ||
| Mainline | 82.7% | 81.8% | 0.9 pts | 82.9% | 82.8% | 0.1 pts | ||
| Regional | 80.3% | 77.3% | 3.0 pts | 80.1% | 77.9% | 2.2 pts | ||
| Consolidated | 82.4% | 81.2% | 1.2 pts | 82.6% | 82.2% | 0.4 pts | ||
| ONBOARD PASSENGERS (000) | ||||||||
| Mainline | 7,331 | 7,780 | (5.8%) | 93,595 | 96,360 | (2.9%) | ||
| Regional | 3,746 | 3,778 | (0.8%) | 46,846 | 45,439 | 3.1% | ||
| Consolidated | 11,077 | 11,558 | (4.2%) | 140,441 | 141,799 | (1.0%) | ||
| CARGO REVENUE TON MILES (000) | ||||||||
| Total | 199,466 | 223,892 | (10.9%) | 2,460,438 | 2,645,600 | (7.0%) | ||
| Preliminary Financial Results | ||||||||
| November 2012 year-over-year consolidated PRASM change | (2.1) | % | ||||||
| November 2012 year-over-year mainline PRASM change | (2.5) | % | ||||||
| December 2012 estimated year-over-year consolidated PRASM change | 2.5 – 3.5 | % | ||||||
| December 2012 estimated year-over-year mainline PRASM change | 1.5 – 2.5 | % | ||||||
| December 2012 estimated consolidated average price per gallon of fuel, including fuel taxes | 3.23 | Dollars | ||||||
| Fourth Quarter 2012 estimated consolidated average price per gallon of fuel, including fuel taxes | 3.29 | Dollars | ||||||
| Preliminary Operational Results | ||||||||
| 2012 | 20113 | Change | ||||||
| December On-Time Performance1 | 78.4% | 82.1% | (3.7) | pts | ||||
| December Completion Factor2 | 99.2% | 99.5% | (0.3) | pts | ||||
Source: United Continental Holdings
